-
Quizzes //
Using map resources
Try this 15-question GCSE quiz to see how much you know about using maps and the evidence you can find on OS maps, isoline maps, choropleth maps and others to answer exam questions. Make sure to download the map extracts below before starting the quiz!
If you haven't already done them, work through the ‘Using map resources part 1’ and ‘Using map resources part 2’ units, which use OS map extracts of North Wales and Cambridge, as well as maps that display data, to find out more. Or look at them again to help fill in any gaps in your knowledge about finding evidence in maps.
HIGH SCORES
| Rank | Name | Score |
|---|---|---|
| 1st | JSD | 28 |
| 2nd | n.m | 28 |
| 3rd | JWS | 28 |
| 4th | TRP | 28 |
| 5th | HSC | 28 |
| 6th | VL- | 28 |
| 7th | JAR | 28 |
| 8th | FAH | 28 |
| 9th | ads | 28 |
| 10th | DS. | 28 |
QUIZZES // Using map resources
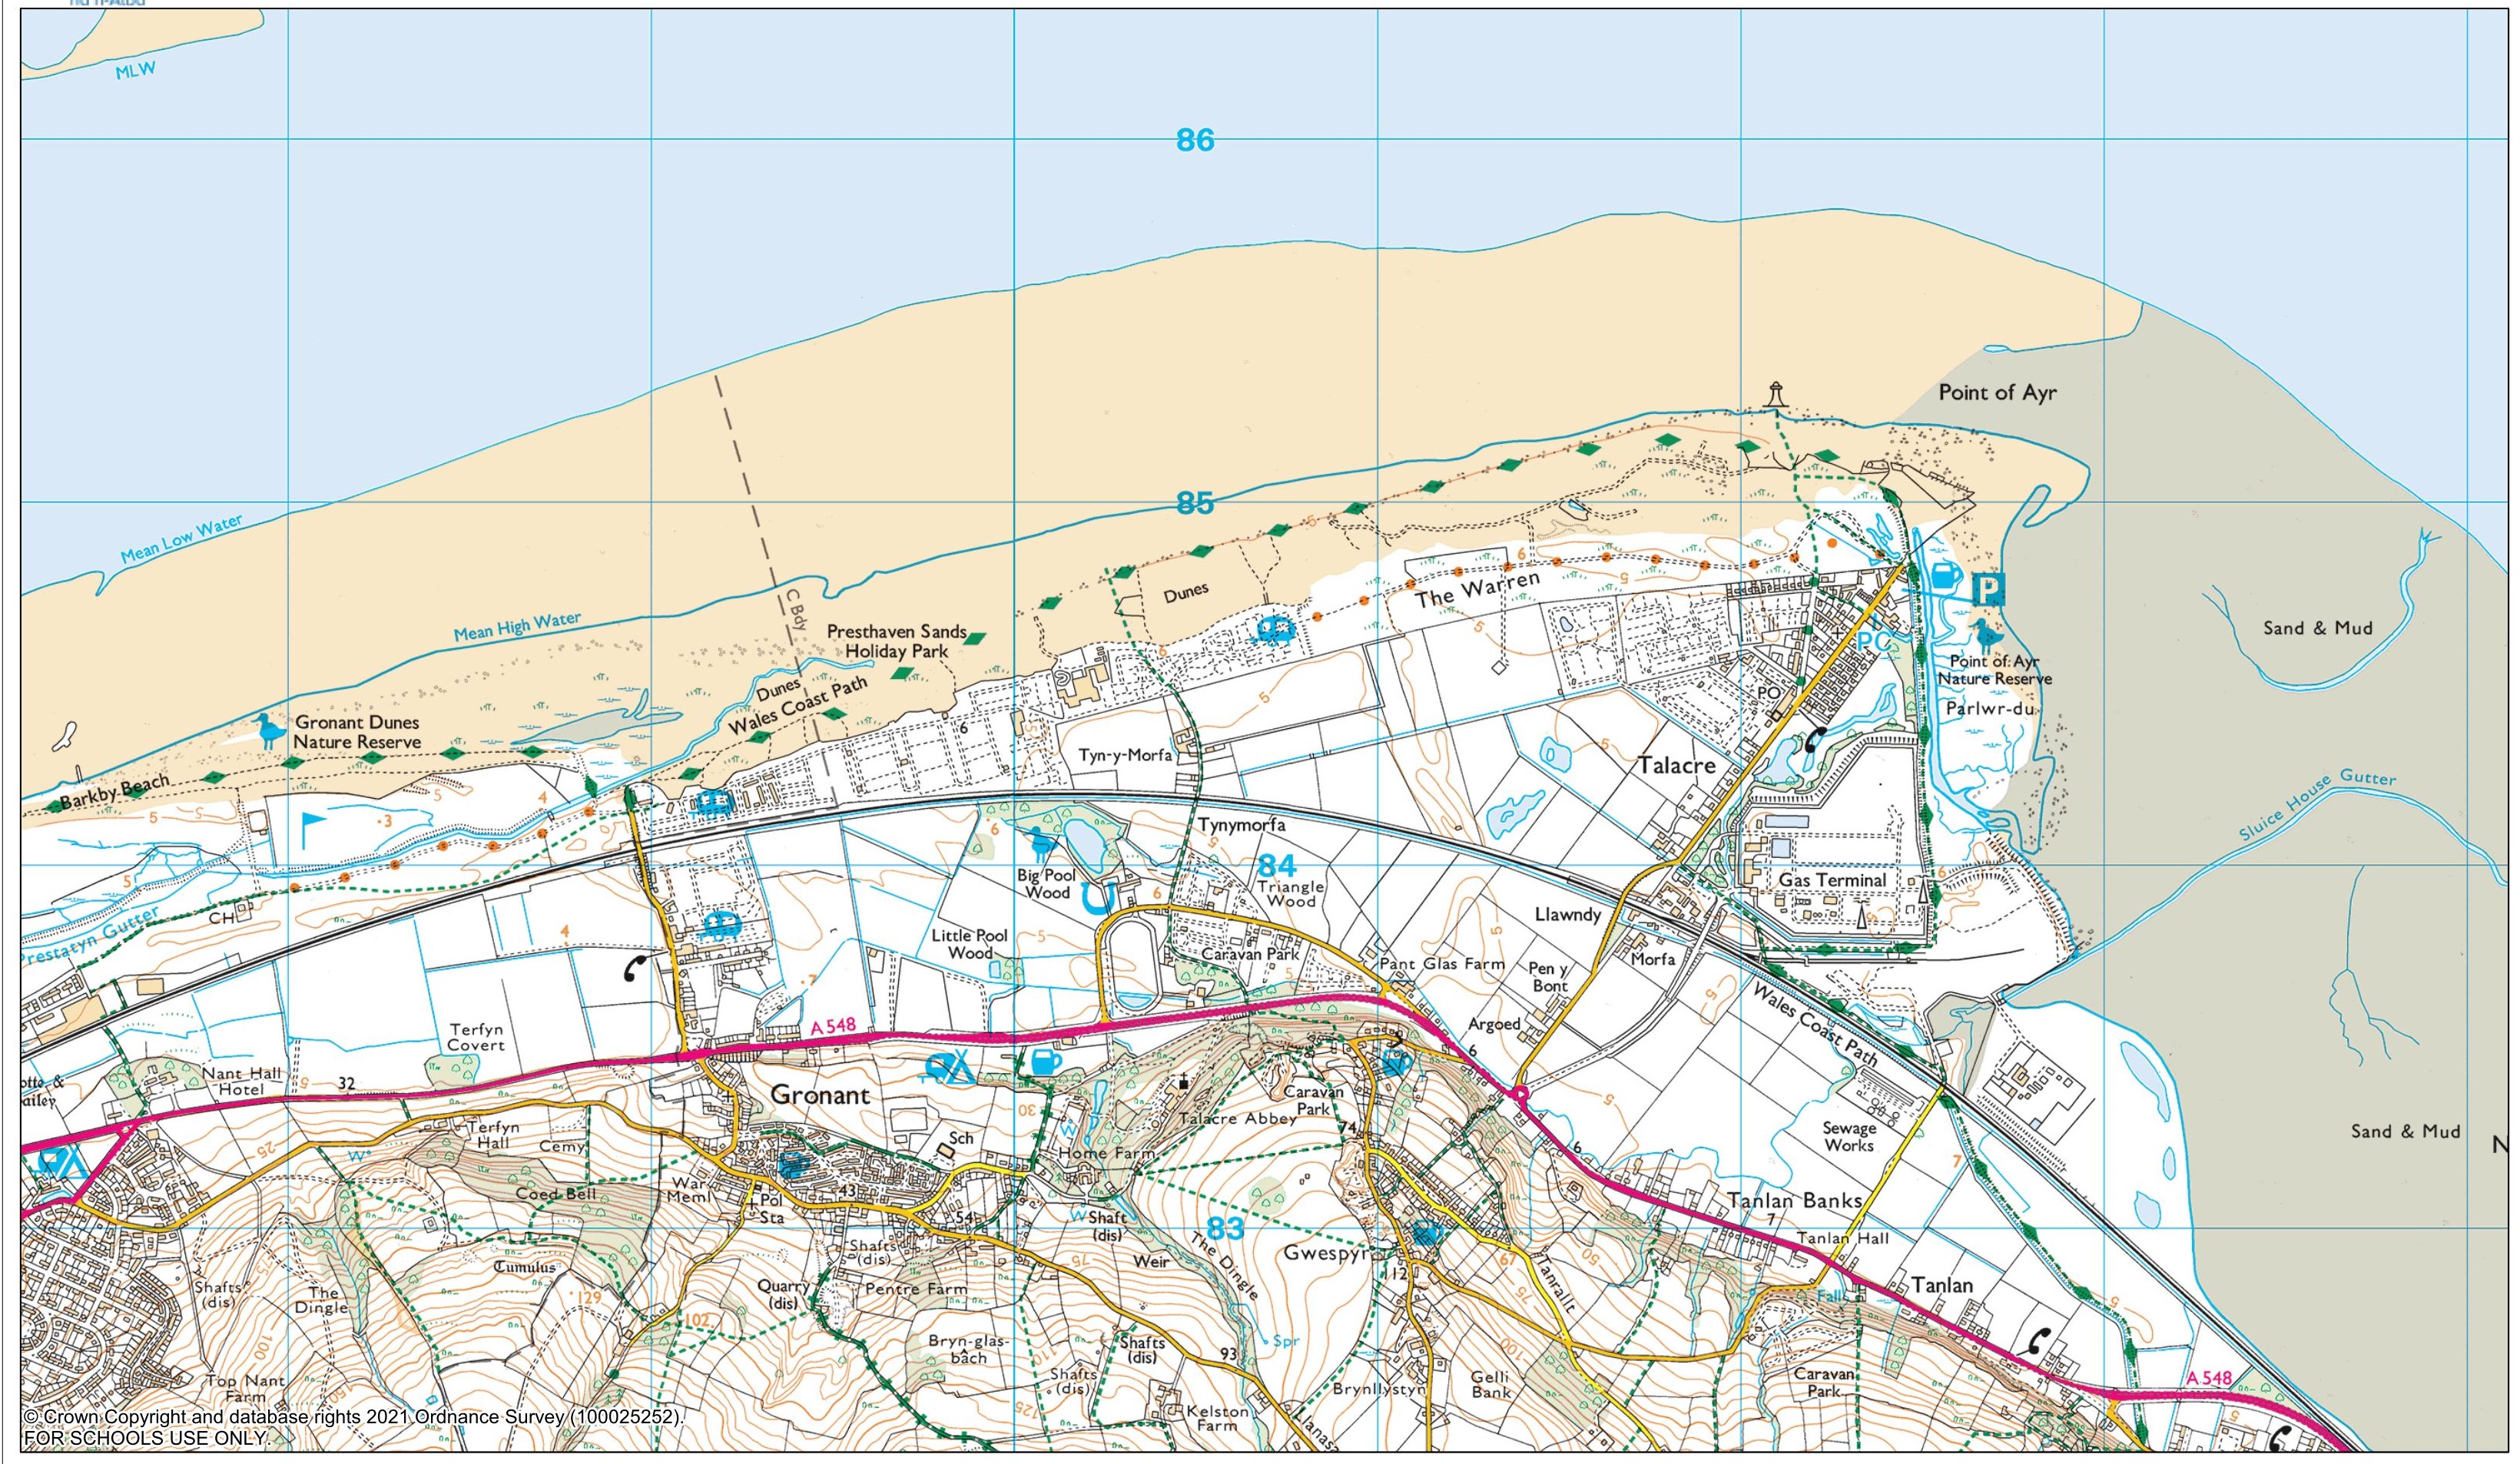
Q1. Study map extract 1 (go back and download the map extracts if you haven't already!). What is the dominant direction of longshore drift along this North Wales coastline?
North to south
East to west
West to east
South to north
Q2. Study map extract 1. Using evidence from the map, suggest how you would know that the A548 runs along the bottom edge of a hill.
The contour lines on the southern side of the A548 are close together, while on northern side they are far apart
The road winds across the landscape and is not straight
It is a main road with many junctions
The road frequently experiences flooding
Q3. Study map extract 1. Name the feature found at grid reference 129850.
An arch
A wave cut platform
A stack
A spit
Q4. Study map extract 1. Name two features seen on the map to suggest that this area is commonly used for leisure and recreation.
The beach and easy road access
Caravan parks and walking trails
A rural landscape and a quiet environment
A golf course and a lighthouse
Q5. Study map extract 1. Suggest one reason why the feature at 129850 may not have extended any further beyond the mainland.
Human interference through building works
Tidal movement of water in and out of the estuary would erode it away
Human extraction of sand for the construction industry
Strong movement of sediment through longshore drift
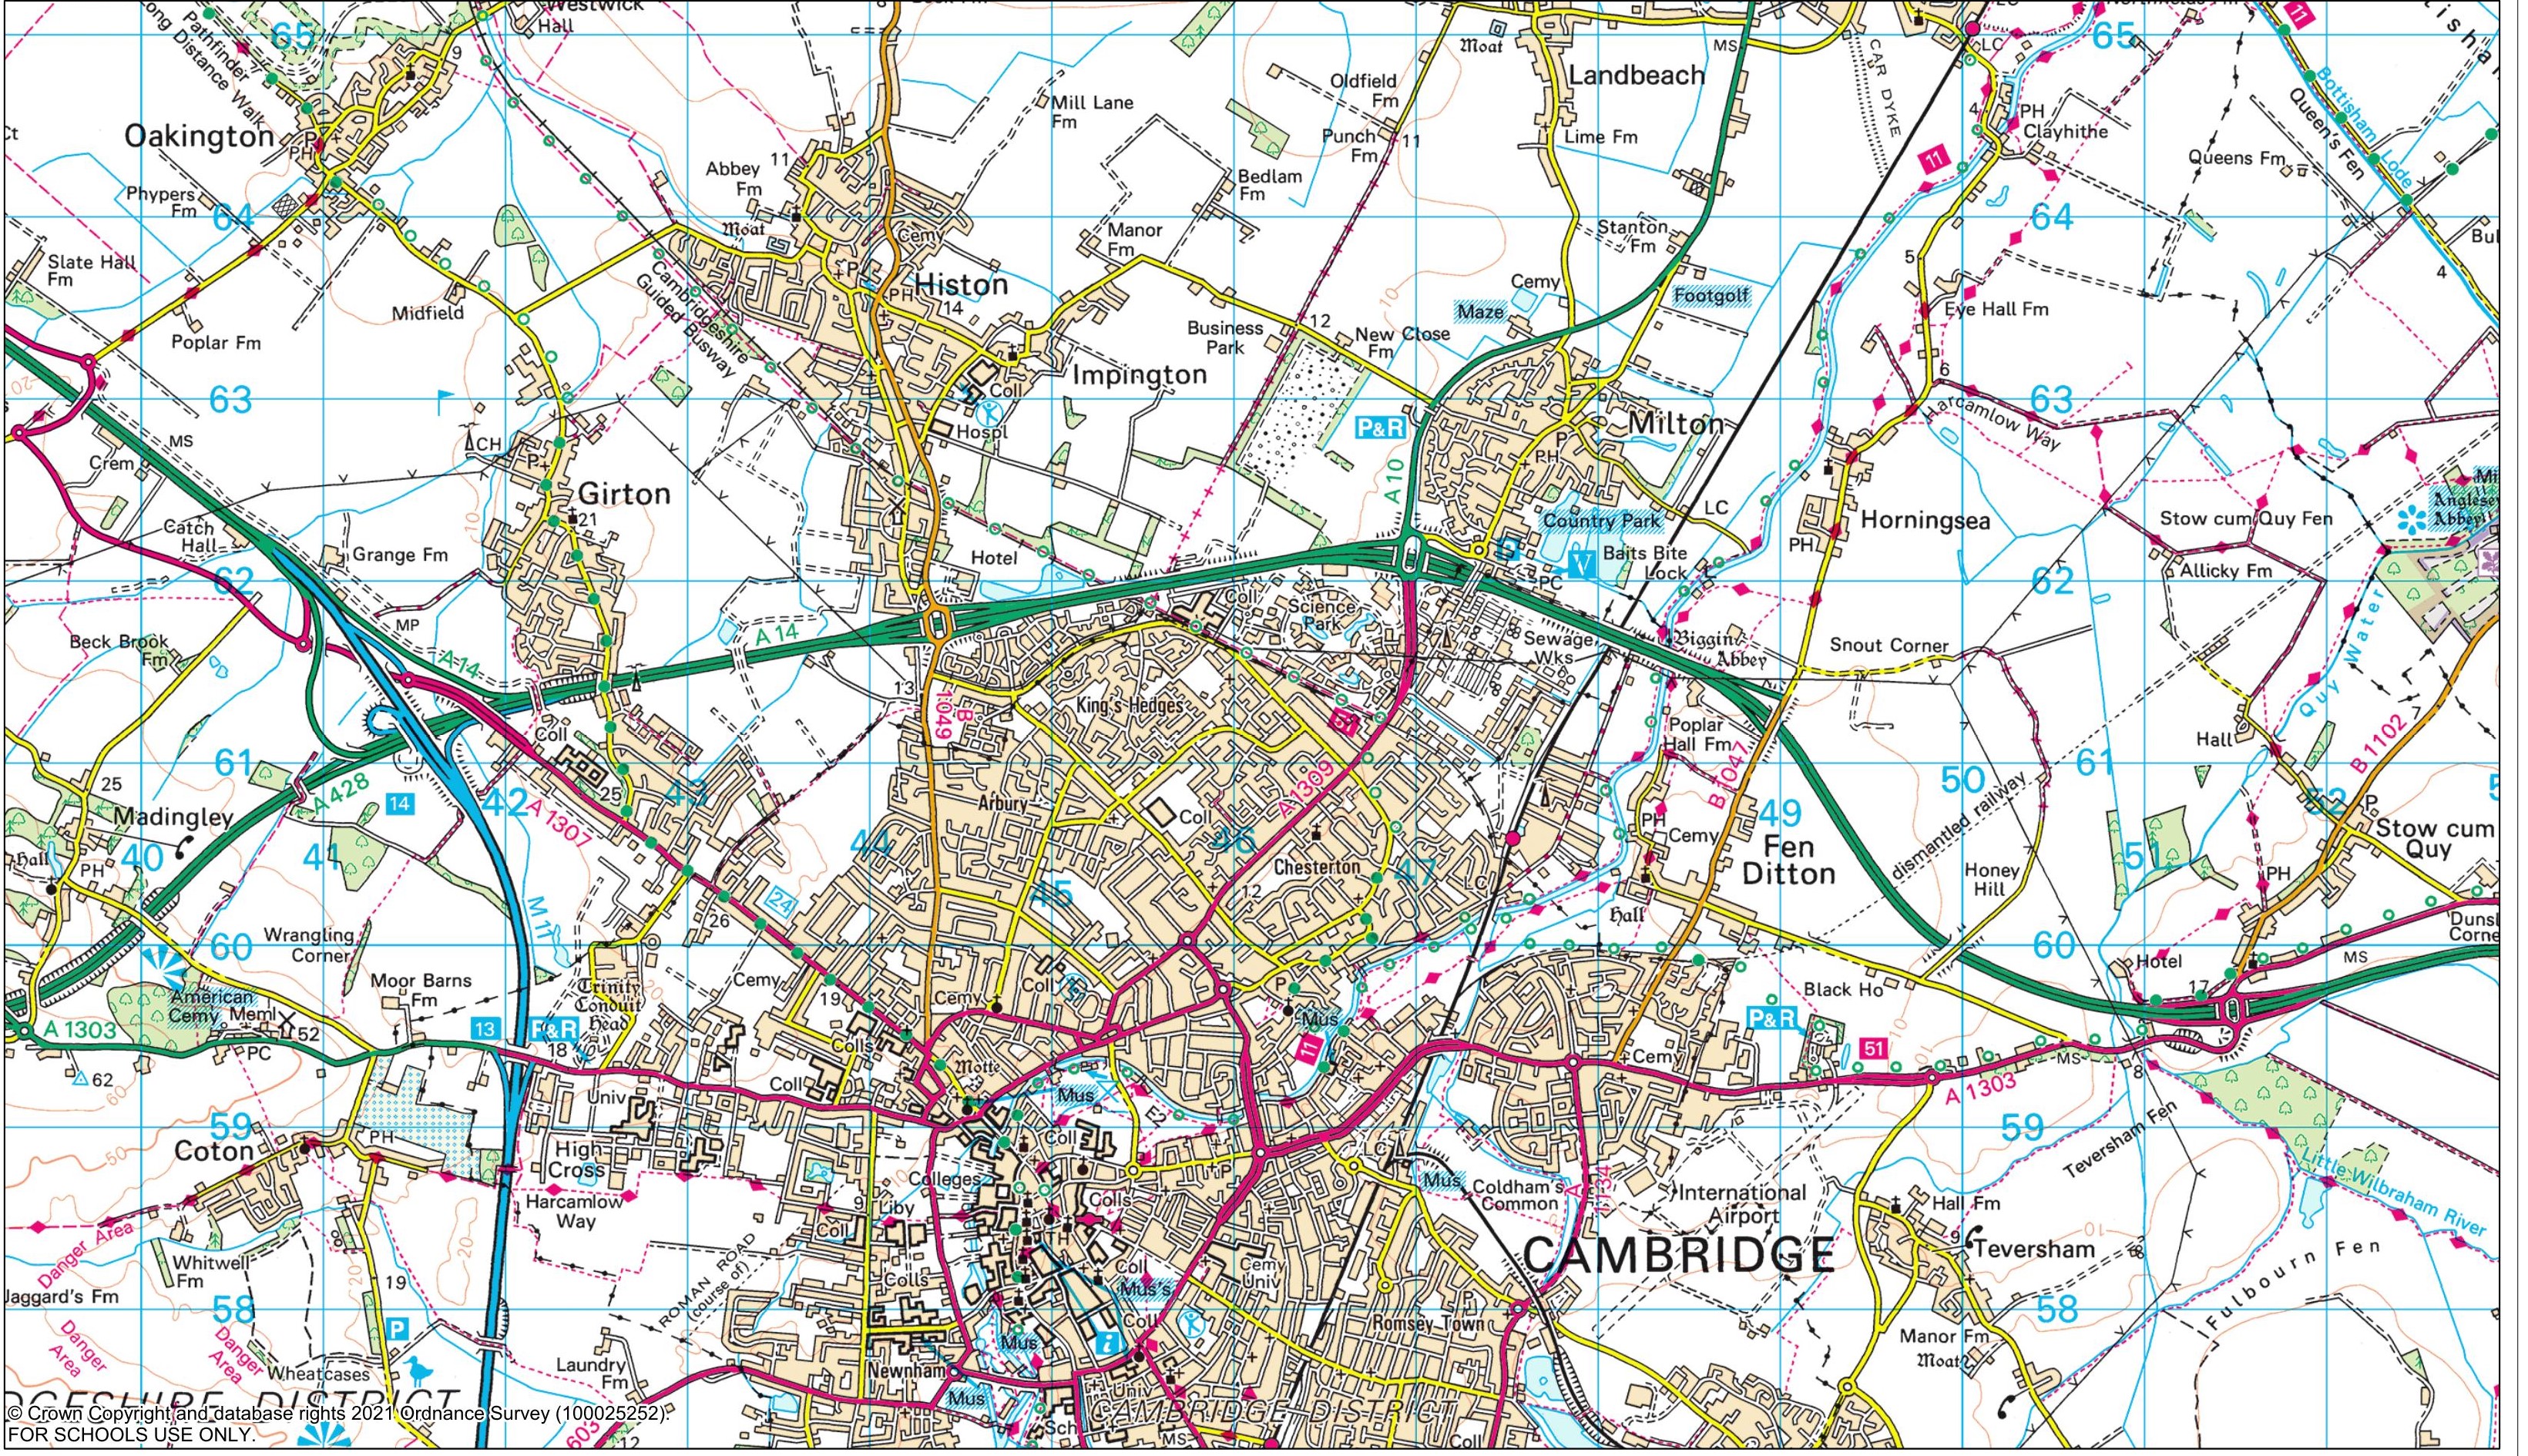
Q6. Study map extract 2. Using evidence from the map extract, suggest a reason why this location (465618) was chosen for the Science Park.
Near to farmland
Close to shops and services
Close to good transport connections (such as a main road)
Cheap land
Q7. Study map extract 2. What evidence in the map extract suggests that this area is well-connected to other locations?
There is an airport nearby
There are large, open spaces
There are main road networks and a railway line
A high population density
Q8. Study map extract 2. Using evidence from the map, suggest two reasons why the village of Horningsea (4962) may be prone to flooding.
It is close to a river and lies on flat ground
It has few flood defences and is on the flood plain
It follows the same shape as the river and sits below the river level
It receives high levels of rainfall and the drainage basin is circular
Q9. Study map extract 2. The area in the east of the map is described as fenland. Using the map to help you, which of the following best describes fenland?
An area of mixed residential land use and woodland
A flat area of high recreational use
A series of interconnected villages
A drained area of flat marshland, predominantly used for farming
Q10. Study map extract 2. Choose a word that best describes the settlement pattern in the south west corner of the map.
Linear
Nucleated/radial
Gridded
Dispersed
Q11. Study map extract 2. Cambridge may have decided to use a ‘Park and Ride’ transport system for a number of reasons. Which of the following reasons is not evident in the map?
Cambridge wishes to improve its carbon footprint
There are limited car parks in the centre of Cambridge
Places like colleges and museums that attract tourists are likely to be visited on foot
Cambridge appears to have a lot of small and narrow lanes

Q12. Study map extract 3. If one were to describe a general pattern of the data on this map, it would be:
The newer the building, the more likely it is to have serious or severe structural damage
The older the building, the more likely it is to have serious or severe structural damage
Buildings constructed between 1950 and 1980 are most likely to have serious or severe structural damage
There is no relationship between building age and structural damage
Q13. Study map extract 3. Which statement best describes the spatial pattern shown in the map?
The buildings in the centre of the road tend to be the newest constructions
The buildings in the centre of the road tend to be less damaged than those at the eastern and western extents
There is no spatial pattern to the amount of damage or the age of the buildings
The buildings in the centre of the road tend to be more damaged than those in the far east and west
Q14. Study map extract 3. Which building could most accurately be described as an anomaly in the context of the data presented.
A
B
C
D
Finished!
You scored this time. The more correct answers you give, and the fewer incorrect answers you guess, the better your score.