-
Quizzes //
Investigating the Index of Multiple Deprivation
Try this 15-question A level quiz to see how much you know about this important data source which is used to explore patterns of human welfare.
If you haven't already done it, work through the ‘Investigating the Index of Multiple Deprivations’ unit to find out more. Or look at it again to help fill in any gaps in your knowledge of measures of human welfare.
HIGH SCORES
| Rank | Name | Score |
|---|---|---|
| 1st | Liv | 30 |
| 2nd | WLH | 30 |
| 3rd | EDP | 30 |
| 4th | PHI | 30 |
| 5th | LCH | 30 |
| 6th | JEH | 30 |
| 7th | JJC | 30 |
| 8th | TDG | 30 |
| 9th | SGH | 30 |
| 10th | AGE | 30 |
QUIZZES // Investigating the Index of Multiple Deprivation
Q1. How do we define ‘deprivation’?
The difference between rich and poor
Lacking the resources considered to be necessary for living in a society
The state of not being equal
A government measure of different areas
Q2. How do we define ‘inequality’?
Lacking the resources considered to be the necessities for living in a society
The state of not being equal
A government measure of different areas
The average income in an area
Q3. Which of these sentences best describes the English Index of Multiple Deprivation?
It is an absolute measure of deprivation that was last calculated in 2019
It is an absolute measure of deprivation that takes place every 10 years as part of the Census
It is a relative measure of deprivation that was last calculated in 2019
It is a relative measure of deprivation that takes place every 10 years as part of the Census
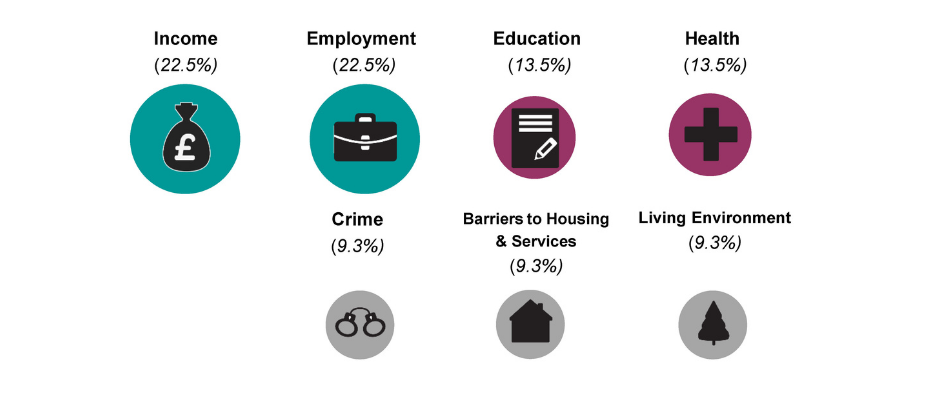
Q4. Which of the following accounts for the highest percentage in the English Index of Multiple Deprivation?
Income
Education
Crime
Health
Q5. Which of the following accounts for the lowest percentage in the English Index of Multiple Deprivation?
Income
Education
Crime
Health
Q6. Which of these is NOT a domain in the English Index of Multiple Deprivation?
Education
Living environment
Access to green space
Health
Q7. What is the average population of the Lower-layer Super Output Areas (LSOA) used in the IMD?
150 people
1500 people
15,000 people
150,000 people
Q8. Why are Lower-layer Super Output Areas (LSOA) used in the IMD?
To compare areas of roughly the same geographical size
To compare areas with roughly the same population size
To compare areas with roughly the same number of regeneration projects
To compare the same areas as government funding is allocated to
Q9. Which urban area had 8 of the top 10 most deprived LSOAs according to 2019 data?
Liverpool
Clacton
Blackpool
Manchester
Q10. When we compare the 2019 data to the 2015 data, which of these statements is true?
Of the neighbourhoods that were in the ‘most deprived’ category in 2019, 88% were also the most deprived in 2015
Of the neighbourhoods that were in the ‘most deprived’ category in 2019, 8% were also the most deprived in 2015
The area east of Jaywick, Clacton-on-Sea was the most deprived area in both data sets
Deprivation in London has gotten worse
Q11. Middlesbrough, Liverpool and Manchester are the local authorities with the highest proportions of ‘most deprived’ areas in the UK. What process affected all three of these areas and led to the deprivation that remains today?
Privatisation
Infrastructure investment
Deindustrialisation
Regeneration
Q12. What has happened to the proportion of London Boroughs with areas that are ‘highly deprived’ since 2015?
There are now no London Boroughs with ‘highly deprived’ areas
Many London Boroughs have seen a reduction in the proportion of their neighbourhoods that are ‘highly deprived’ since 2015
Many London Boroughs have seen an increase in the proportion of their neighbourhoods that are ‘highly deprived’ since 2015
Many London Boroughs have seen no change in the proportion of their neighbourhoods that are ‘highly deprived’ since 2015
Q13. Which of the following is NOT a reason why measuring the IMD is important?
To determine which areas need regeneration
To measure the success of regeneration in an area
Because levels of deprivation are known to impact people’s lived experience of, and engagement with, places
To calculate the population of the UK
Q14. Which of these statements about the English IMD is true?
The area ranked 1st is the most deprived area in England whereas 32,844th is the least deprived in England
The area ranked 1st is the most deprived area in England, whereas 12,844th is the least deprived in England
The area ranked 1st is the least deprived area in England, whereas 32,844th is the most deprived in England
The area ranked 1st is the least deprived area in England, whereas 12,844th is the most deprived in England
Q15. Which of these statements names a problem with using the IMD?
Some of the data is more than a year old by the time it is published
It covers the whole country of England
It is collected by the Government
It contains 7 different domains
Finished!
You scored this time. The more correct answers you give, and the fewer incorrect answers you guess, the better your score.